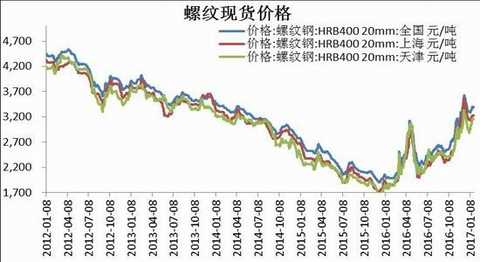
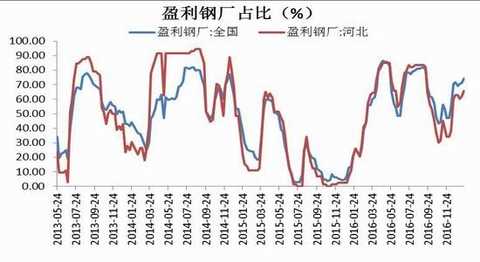
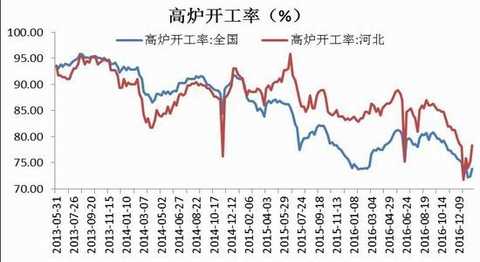
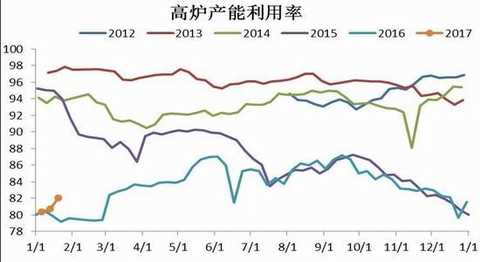
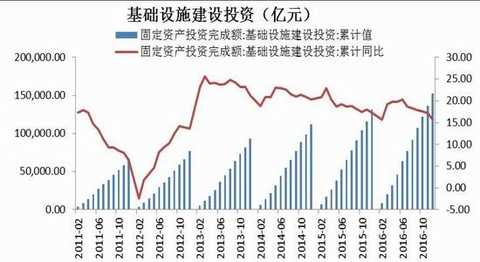
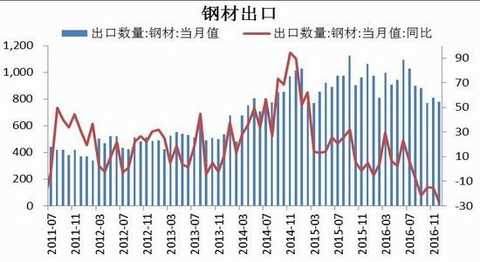
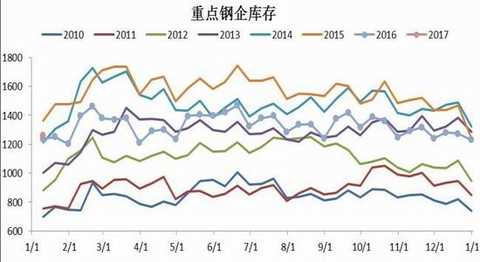
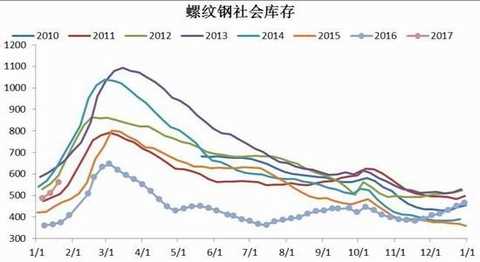
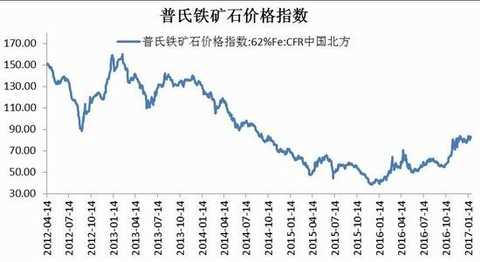
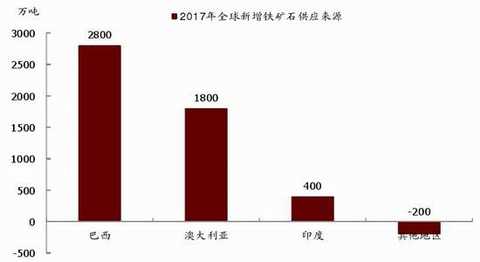
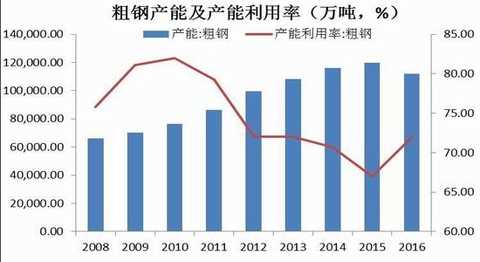
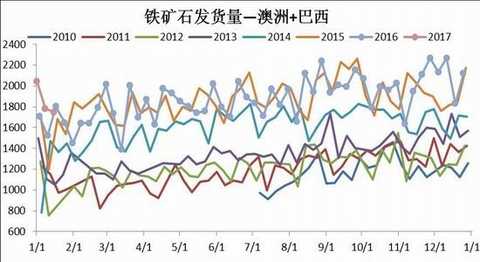
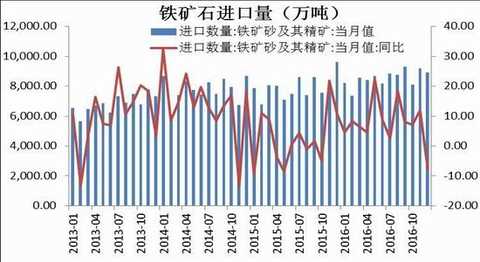
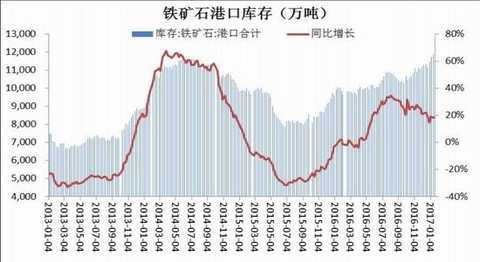
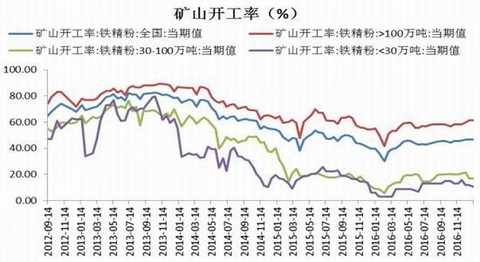
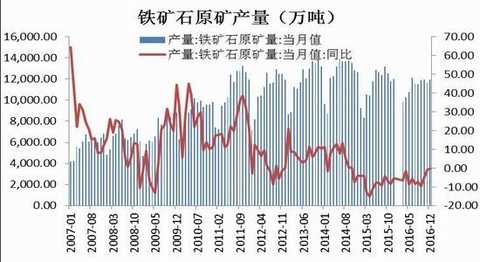
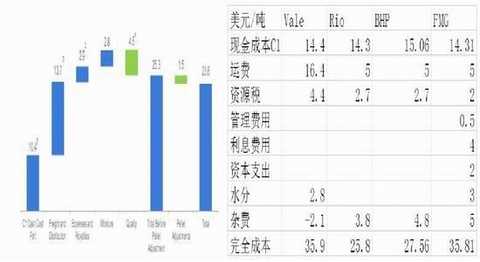
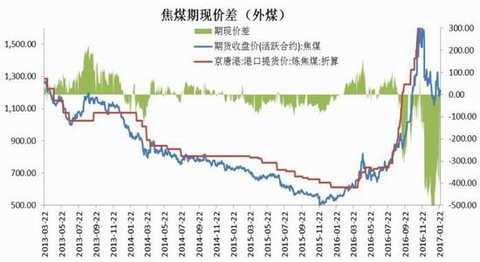
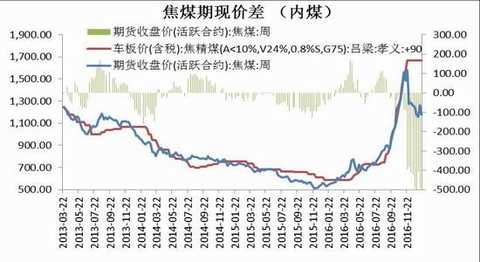
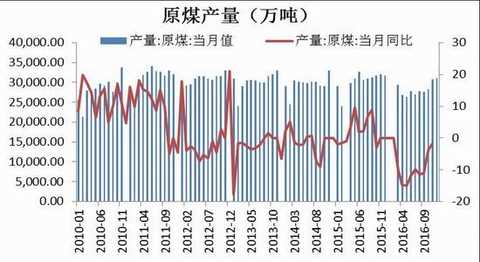
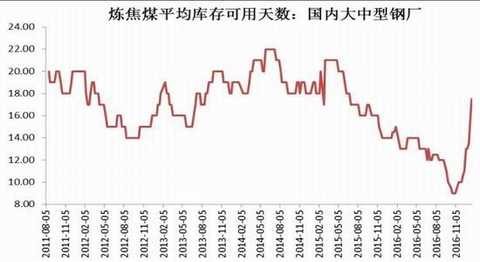
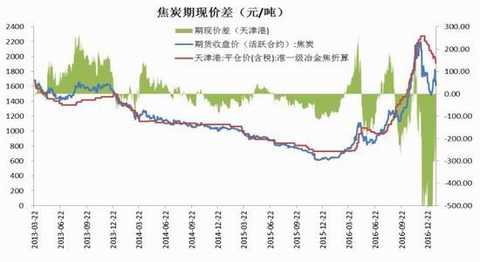
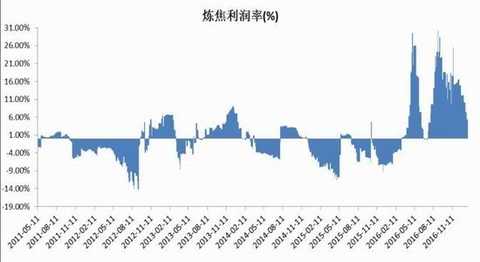
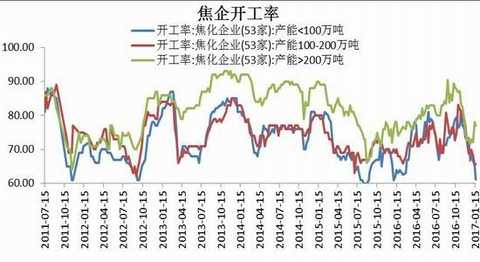
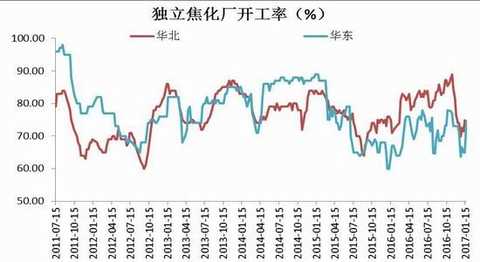
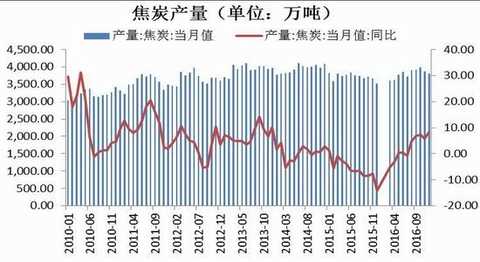
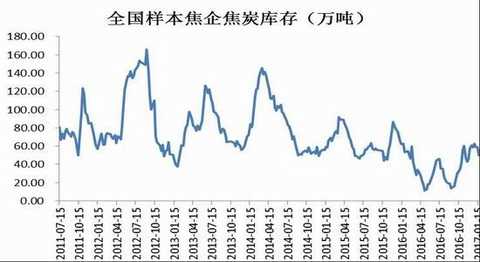
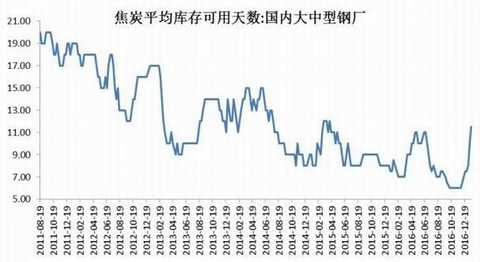
abstract In January, the profit of the steel mills remained at a good level, and the enthusiasm of the traders to replenish the warehouse was high. Due to the significant replenishment and the optimistic expectation of the later de-capacity, the black line rose again. On January 10, the deadline for clearing the “strip steel†rose to a political mission, and the mid-range furnace speculation revived, and the emotional funds surface drove the black line to a large upside repair period. Rebar: At present, the cost end support is weakened, the supply end is under pressure, the demand end is sharply declining before the holiday, and the terminal demand still falls back. The rebar is treated in the early part of February, and a small amount of empty orders can still be circulated. After the middle and late If the demand is gradually restored, the capacity is expected to be expected or the steel price will rise. Iron ore: At present, high-quality resources have rebounded slightly, and coke recovery has put pressure on ore, but steel mills have a good profit. The structural shortage continues and the iron ore spot is still relatively strong. If the above two conditions have not improved significantly, it is not recommended to rush. Coal char: The mainstream coke spot continued to pull back, and the coking profit gradually declined. Port inventories continued to increase, merchants actively shipped, and steel replenishment continued to rise to a safe threshold. At present, there is still support at the coking coal end. If the downstream demand picks up after the holiday, the profit of the steel mill will remain stable and upward. In the middle and late February, the upside can be expected, and the 5-9 positive set can be intervened. Coking coal: Close to the Spring Festival coal mines, low-sulfur coking coal resources are still tight; Australia's coking coals fall, replenishment into the safety threshold and this week's environmental protection limit production coking coal up and down pressure, unilaterally wait and see, 5-9 positive sets can be a small amount of intervention . In the middle and late February after the holiday, it will be driven by downstream steel. I. Analysis of fundamentals of steel ore In January, near the Spring Festival, in the context of the continued decline in downstream terminal demand, the spot price of rebar is not weak, traders are optimistic about the market outlook, and the enthusiasm for replenishment is not diminished; steel mills still insist on the price, and the ex-factory price is maintained in mid-January. Constant or rising. Shanghai's thread conversion is basically maintained at the level of 3200-3300. As of January 28, the average price of HRB400 material 20mm rebar in 24 cities nationwide was 3389 yuan/ton, and the latest spot price estimates in Tianjin and Shanghai were 3160 yuan/ton and 3230 yuan/ton respectively, up 230 times from the beginning of the month. Yuan/ton and 80 yuan/ton. Figure 1: Rebar spot price unit: yuan / ton Source: Wind, Cinda Futures R&D Center In January, the profit share of steel mills rose from 69.33 to 74.23%, up 4.9 percentage points. As the coke at the end of the furnace continued to fall, and the downstream traders continued to replenish the warehouse, the profit of steelmaking gradually recovered, and the overall profitability rebounded. And in January, although it was the off-season in the pre-holiday period, due to the strong replenishment power of the downstream, the steel price was firm, and the steel mills' willingness to cut production was not strong. As can be seen from the figure, the utilization rate of blast furnace capacity has gradually recovered from January, and has risen from 80.35% at the beginning of the month to the current 82.05%. In addition, the persistent shortage of high-quality mines also reflects the high enthusiasm of steel mills. Figure 2: Steel mill profit face unit: % Source: Wind, Cinda Futures R&D Center Figure 3: Blast furnace operating rate, capacity utilization unit: % Source: Wind, Cinda Futures R&D Center From the data of the ten-day crude steel production, since the early days of December, the crude steel output in the first half of January has stabilized and rebounded, up 9.18% year-on-year. In the context of sluggish terminal demand, the re-stabilization of crude steel Nissan is mainly due to the optimistic expectations of traders on the market outlook, and the strong steel prices have led to strong production willingness. Considering that the daily output of crude steel will increase seasonally, and the current utilization of blast furnace capacity is still at a low level, the probability of maintaining stable production in the later stage is greater. Figure 4: Average daily output of crude steel Unit: 10,000 tons / day Source: Wind, Cinda Futures R&D Center In terms of terminal demand, from January to December, the cumulative sales area of ​​commercial housing was 157.349 million square meters, a year-on-year growth rate of 22.5%, and the growth rate continued to fall. At the same time, affected by the country's strict control measures, the National 100 City Housing Price Index continued to fall as of November. Among them, the decline in first- and second-tier cities is more obvious. Up to now, the national 100 city housing price index in September was 0.88%, compared with 25.2% year-on-year. Figure 5: Commercial housing sales area, 100 city price index unit: 10,000 square meters, % Source: Wind, Cinda Futures R&D Center In December, the saleable area of ​​commercial housing was 69,539,000 square meters, a year-on-year decrease of 3.2%, and the decline was expanded. The total inventory has once again rebounded to the October level. As of January 22, the ratio of commodity housing to sales in the top ten cities was 38.58, and the overall backwardness remained stable. According to estimates, the overall inventory cycle is still declining, but the de-stocking tasks of the third- and fourth-tier cities, which are both in need and low in investment demand, are still heavy. At the same time, the first- and second-tier cities are affected by real estate regulation and control. slow. Figure 6: The area of ​​sale of commercial housing, inventory and sales volume of the top ten cities: 10,000 square meters, % Source: Wind, Cinda Futures R&D Center From January to December 2016, the land area purchased this year was 220.25 million square meters, a year-on-year decrease of 3.4%, and the decline was narrowed by 0.9 percentage points. In 2016, the land purchase area decreased by 28.3 percentage points from the end of the year, but the implementation of the property market regulation policy was also accompanied by the strengthening of the land market supervision. It is expected that the land supply growth rate will not continue to pick up. From January to December, the newly started housing area was 166.928 million square meters, an increase of 8.1% year-on-year, and the growth rate increased by 0.5 percentage points. Affected by the slowdown in sales growth and the slowdown in the supply of land area, the growth rate of new construction area has dropped. Figure 7: Purchased land area, new construction area of ​​the house: 10,000 square meters, % Source: Wind, Cinda Futures R&D Center In summary, short-term restrictions on real estate regulation and superimposed pre-holiday terminal demand in the off-season, the overall performance of real estate data in December was deceived, but 2016 real estate development investment is better than 2015, due to the large base, short-term still Supporting demand, and taking into account the time lag effect of development investment and real estate start-up on downstream steel demand, it is expected that real estate will still support the demand side in the first half of 2017, and terminal demand is expected to gradually pick up in late February. In the second half of the year, the country's stricter purchase restriction policy for first- and second-tier cities is still a haze over real estate investment. If there is no effective stimulus policy in 2017, the investment growth rate will probably fall back. In December, the PMI manufacturing index was 51.4%, down 0.3 percentage points from the previous month, but remained above the line. The manufacturing PMI declined in December, mainly due to a decline in the production index. Near the Spring Festival, manufacturing production has slowed down; at the same time, due to the continuous smog weather, enterprises have stopped increasing production limits, and environmental pollution has affected manufacturing production. Although the production index has declined, it is still the highest of the five sub-indices, indicating that the current production situation is still good. The non-manufacturing PMI fell by 0.2 percentage points to 54.5%, the service industry index fell back, and the construction industry expanded. From January to December, infrastructure investment increased by 15.71% year-on-year, which was 1.5 percentage points lower than the growth rate of January-November. It increased by 1.77% in the month of December and 5.71% year-on-year. China’s economic growth rate during the “Thirteenth Five-Year Plan†period is maintained at above 6.5%. Under the background of depressed economic pressure and low private investment in fixed assets, infrastructure investment is an important means of steady growth, while infrastructure-based PPP projects Will be a strong support. The project that entered the actual implementation stage of the PPP project started to grow faster in the second half of the year. By the end of October, the project landing rate was 28%, an increase of 8 percentage points from the beginning of the year. According to statistics, the infrastructure projects represented by PPP have improved from both the number of bidding and the implementation of the project, and the infrastructure needs will be launched after the year. On the whole, although the growth rate of infrastructure investment has declined somewhat, as an important means of economic bottoming, the follow-up infrastructure projects will continue to exert strength. Figure 8: Manufacturing PMI Index, Infrastructure Investment Unit: 100 million yuan, % Source: Wind, Cinda Futures R&D Center According to customs statistics, in December 2016, China exported 7.8 million tons of steel, down 320,000 tons from the previous month, down 26.83% year-on-year; in 2016, China exported 10.843 million tons of steel, down 3.5% year-on-year. Since July, China's steel exports have continued to decline, mainly due to the significant increase in domestic steel prices, which has narrowed the domestic and international price gaps, weakened export competitive advantages, and declined export enthusiasm. In addition, international trade friction is another important factor affecting China's steel exports. As China's steel export volume has increased year by year, the global trade friction against China's export steel products has also increased, and the domestic supply and demand structure has been further improved. It is expected that steel exports may continue to decrease in the later period. But overall, in the context of the continued growth of global steel demand, China's steel low-cost competitive advantage is still there, while the “One Belt, One Road†countries and emerging markets to develop infrastructure to the Chinese steel demand is forming a positive. Figure 9: Steel export units: 10,000 tons, % Source: Wind, Cinda Futures R&D Center From January to December 2016, China's crude steel output was 807.37 million tons, a year-on-year increase of 0.57%. In December, the output of the month was 67.22 million tons, an increase of 4.42%. In December, overhaul of steel mills increased, capacity utilization continued to decline and remained low. At the same time, medium-frequency furnaces stopped production and production storms, which also led to a decline in related steel production. However, due to the good profit of steel mills and the low base rate last year, the effective capacity in de-capacity accounted for Small, 2016 annual production still increased year on year. On January 10, 2017, the Steel Association Council requested 6/30 to completely ban the strip steel. The 17-year capacity increase is expected to strengthen, or it will become the main factor in the first half of this year, paying close attention to the post-implementation efforts and effects. According to relevant news statistics, China's intermediate frequency furnace capacity is about 110 million tons, and the output is between 50 million and 60 million tons, of which rebar accounts for about 80%, accounting for 16-18% of the national rebar production. Or there is a supply gap. Figure 10: Crude steel production unit: 10,000 tons, % Source: Wind, Cinda Futures R&D Center The downstream replenishment was positive, and the steel enterprise stocks were transferred to traders. At the same time, the output of the steel enterprises did not fall significantly due to the good profit. The inventory of key steel enterprises fell slightly, from 12.81 million tons in the first ten days of December to the current 12.5697 million tons. As downstream traders are still optimistic about next year's expectations, procurement efforts will be strengthened, and the society will continue to accumulate one month ahead of previous years and rise for nine consecutive weeks, with a current value of 5.6188 million tons. Figure 11: Key steel enterprise inventory, social inventory unit: 10,000 tons, % Source: Wind, Cinda Futures R&D Center In October, the coal-coke cost-end conduction led to the upswing and the structural shortage of high-grade ore was the main logic leading to the surge in iron ore prices. After the end of November, on the one hand, the loosening of coal coke prices led to a gradual weakening of the cost-driven rise logic; on the other hand, the seasonal decline in terminal demand, steel mills are still willing to resume production under profit-driven, demand is low season, inventory accumulation is superimposed The contraction was less than expected, and the steel price drove the ore back down. On January 10, the deadline for clearing “strip steel†rose to a political mission, and the mid-frequency furnace speculation revived. The emotional funds face the sharp upward revision period of iron ore. Figure 12: Platts index unit: USD / dry ton Source: Wind, Cinda Futures R&D Center Subject to supply-side reforms and environmental pressures, it is expected that the supply of iron ore in China will still be difficult to increase significantly in 2017. The determining factors determining the supply price of minerals still depend on foreign mainstream mines. In 2017, as the two mines of BHP and FMG announced that they will suspend the construction of new projects, a small increase in the three mines in Australia may come from Royhill, Hamersley Iron and Hancock Prospect. The remaining new iron ore capacity variables are mainly from Vale. Caragas S11D project. According to CICC's measurement, the global supply of new iron ore in 2017 is expected to be 50 million tons, of which 2 million tons will be shut down and the net new supply will be 48 million tons. According to the worldsteel forecast, the global steel demand in 2017 will increase by 0.5% year-on-year, and the global steel demand will increase by about 7.5 million tons, equivalent to an increase of 12 million tons of iron ore demand, to estimate the global iron in 2017. The oversupply of ore is about 36 million tons. In addition, supply in non-mainstream countries will be a destabilizing factor in the market. Figure 13: 2017 foreign mine increase production plan unit: USD / dry ton Source: CICC, Cinda Futures R&D Center According to the rough estimate of the Metallurgical Chamber of Commerce, the regular production capacity of steel in 2016 is about 1 billion tons, and the medium-frequency furnace capacity of 80-120 million tons is not included. In summary, the national steel production capacity slightly exceeds 1.1 billion. Ton. According to the State Council's plan for the steel industry, the replacement of steel capacity in the later period is based on the principle of equal or reduced volume. At present, China has basically stopped the approval of new crude steel production capacity projects, and the newly added production projects will continue to decrease. Some of the key new projects that can be seen at present are Zhanjiang Iron and Steel, Rizhao Boutique and Shougang Jingtang, which is expected to be 2016- The total capacity of crude steel put into production in 2018 is about 26 million tons. In other regions, capacity replacement work is often carried out, such as in Hebei. Figure 14: Crude steel capacity unit: 10,000 tons Source: Wind, Cinda Futures R&D Center After the peak of the previous shipments, the shipments of Brazil and Australia both declined. The overall shipment volume of iron ore in January showed a downward trend, from 20.42 million tons at the beginning of the month to 17.47 million tons. This year, the rainy season in Australia and Brazil has been postponed, so the mine shipments remained at a high level in December. In addition, in the first half of this year, the mine did not complete the annual shipment plan, and in the fourth quarter also increased the delivery. After entering the off-season in January, shipments began to decline. According to statistics, the shipments of iron ore in Australia and Brazil are seasonally low in January and February due to factors such as the southern hemisphere rainy season, while domestic iron ore import data also show that most countries imported iron ore in January and February. The decline was significant (except for the increase in imports in January 2014). Before the holiday, it is still the off-season of China's demand. At present, the replenishment of steel mills has been basically completed, and the shipments are weaker and stable after the year. From January to December 2016, the cumulative import volume of iron ore in China was 88.95 million tons, down 7.6% year-on-year, and both fell in the same period. In December, the iron ore port inventory is roughly judged that the port inventory will still increase in the later period, but the space is limited. After reaching a certain level, it may fall back. The recent decline in shipments from Australia and Brazil is also evidence. Figure 15: Seasonal chart of foreign mine shipments Unit: 10,000 tons Source: Wind, Cinda Futures R&D Center Figure 16: Iron ore import unit: 10,000 tons Source: Wind, Cinda Futures R&D Center In terms of domestic mine supply, due to the continuous rebound of ore, the operating rate of internal mines bottomed out after the year, and by mid-May, with the fall of the mining price, the operating rate began to weaken, and began to receive steel prices in late July. Boosted, and stabilized and rebounded slightly. In August and September, with the increase in the price of minerals, the operating rate of iron ore began to rise. In October, November and December, the mine operating rate maintained a steady upward trend. As of January 13, the national mine operating rate was 46.5%, and the cumulative output of raw ore from January to December was 1,280,890,000 tons, down 7.27% year-on-year. Figure 17: Domestic mine operating rate and iron ore raw ore production unit: %, 10,000 tons Source: Wind, Cinda Futures R&D Center Iron ore prices have entered a flat cost area and the downward momentum has slowed down. According to the annual report released by Vale, there are three important areas for global iron ore costs: the four mines have the lowest cost and are in the first group, and the supply is huge to 1.14 billion tons. Due to problems such as taste conversion, FMG and The cost of VALE is quite high, at around $35.8, Rio Tinto has the lowest cost, only $25.8. Vale's production capacity is expected to reach around 450 million tons by 2018, and there is still room for cost reduction. The cost of S11D projects can reach 23.8 dollars, and the cost of second-tier mines in Australia is more than 40-50 dollars. Figure 18: Four major mine cost measurement units: USD/ton Source: Vale, Cinda Futures R&D Center Coal char fundamental analysis In January, before the festival, the coal mines were discontinued, and the low-sulfur and high-quality resources at the coking coal end were still tight. In the context of the continuous decline of the mainstream coke and the sharp correction of the Australian coking coal, the coking coal spot was relatively strong, and only some regions had high sulfur resources. On the futures side, the influence of the material end has a wide fluctuation. At present, the spot price of coking coal is maintained at 1600-1650 yuan/ton, and the current price difference is narrower than the previous period. Figure 19: Current price difference during coking coal unit: yuan/ton Source: Wind, Cinda Futures R&D Center Under the influence of 276 working days, coking coal production maintained a rapid decline, and monthly capacity contracted by more than -10%. At the same time, it is also the severe contraction of coal supply, which leads to a reversal of the marginal supply and demand pattern, and coal prices have skyrocketed in a short period of time. In order to solve the problem of continued tight supply of coal and irrational increase in coal prices, the Development and Reform Commission has held five coal market situation symposiums since September this year. Its main content is to release the capacity of “advanced capacity†mines with a total capacity of 1.8 billion tons, including about 350-380 million tons of coking coal mine capacity, an average daily production increase of about 175,000 tons, and an increase of about 14 million tons. The monthly average production increased by 4.6 million tons of coking coal. Up to now, the year-on-year decline of coking coal has narrowed by 7.36 percentage points from 12.1% in September, and the decline has been shrinking significantly. Figure 20: Production of raw coal and coking coal Unit: 10,000 tons Source: Wind, Cinda Futures R&D Center Affected by the reform of coal supply side, domestic resource supply was tight, and high-quality coking coal was in short supply. At the same time, the price of external coal began to fall sharply in December, which led to a significant increase in import volume. According to customs data, China imported 5.86 million tons of coking coal in December, a year-on-year increase of 31.83%, an increase of 23.37% from the previous month. From January to December, the cumulative import was 59.23 million tons, a year-on-year increase of 24.37%, an increase of 10.99%. Figure 21: Coking coal import unit: 10,000 tons Source: Wind, Cinda Futures R&D Center As for port inventory, due to the shortage of coking coal, the price of external coal has risen sharply, the price of domestic and foreign products has been upside down, and the port inventory has fallen sharply. Beginning in December, the price of external coal began to fall sharply. The replenishment of superimposed steel mills and coke enterprises focused on coal continued, and the volume of trade increased. In January, port inventory growth continued. Up to now, the total inventory of imported coking coal in the coastal five ports has reached 2.648 million tons, an increase of nearly 348,000 tons from the beginning of the month. Figure 22: Coking coal port stock unit: 10,000 tons Source: Wind, Cinda Futures R&D Center In terms of steel coke enterprise inventory, due to the comprehensive elimination of the intermediate frequency furnace before the capacity is superimposed 6/30, the later consensus is expected to be strong, and the steel coke enterprises will focus on the coal replenishment. Up to now, the total inventory of sample steel mills was 6.28 million tons, an increase of 343,000 tons from the beginning of the month, an increase of 5.83%; the total inventory of sample coking plants was 5.1.13 million tons, an increase of 162,900 tons from last week, up 1.74% from the previous month. Domestic large and medium-sized steel mills have a significant increase in the number of available coking coal stocks to 17.5 days. The coking coal end currently fills the reservoir into a safety threshold. Figure 23: Downstream coking coal stocks: 10,000 tons, days Source: Wind, Cinda Futures R&D Center In January, due to the good profit of steel mills, the coke replenishment continued, but the spot side of coke continued to decline. The profit of Jiao enterprise has dropped significantly. The environmental protection and production limit has been superimposed. The start of the coke enterprise has also been greatly adjusted. The price of coking coal has formed pressure, but at the same time, the shortage of high-quality resources of coking coal is also supported by coke formation. On the futures side, due to the unanimous expectation of the market outlook, the coke futures turned heads upwards, and the current price difference in the coke period narrowed sharply. Figure 24: Current price difference in coke period Unit: RMB/ton Source: Wind, Cinda Futures R&D Center From the perspective of the status of the industrial chain, coke is still in a situation of being squeezed at both ends. The traditional conduction path is: thread profit affects coking profit, coking profit affects coal mine profit; but under the current supply side reform, the coal end is obviously tightly biased by the 276 policy, and the coking coal is stable, the thread is weak, usually the thread profit Fallback will further squeeze coking profits. The short-term mismatch between supply and demand in the early coking period made the coke stage strong, and the profit remained at 200+. After entering the off-season in January, the thread spot was temporarily stabilized, but the terminal demand was stagnant and the coke spot side appeared to have a correction. At present, the coking coal cost support and the optimistic expectation of the market outlook will support the coke price, and the coking profit will remain stable. Figure 25: Coking profit margin unit: % Source: Wind, Cinda Futures R&D Center In terms of coking operating rate, coking profits continued to narrow due to spot-side corrections. Small and medium-sized coke enterprises were also affected by environmental factors, and the large-scale coke enterprises also experienced a sharp decline in the early stage of construction, but they began to rebound from January. At present, the operating rate in North China is 74.5, up 3.1 percentage points from the beginning of January. The operating rate in East China is 74.5, up 9.6 percentage points from the beginning of January. Figure 26: Coking enterprise operating rate unit: % Source: Wind, Cinda Futures R&D Center Coke production was driven by coking profits. Although the chain was affected by seasonal factors, the growth rate remained stable. The cumulative output of coke from January to December was 449.11 million tons, up 0.3% year-on-year. In December, coke production was 38.06 million tons, up 8.19% year-on-year, and the year-on-year growth rate continued to expand. In the first half of the year, coke production was basically on the rise, but it has been declining year-on-year. At the same time, coking enterprises are facing great environmental pressure. Shanxi, Hebei, Shaanxi, Shandong and other coking provinces frequently recited the illegal environmental pollution behavior of coking enterprises. The start-up of enterprises has also been greatly affected, but driven by profits, the production enthusiasm of coke enterprises is still high, and the overall situation of 2016 remains expanding. Figure 27: Coke production unit: 10,000 tons Source: Wind, Cinda Futures R&D Center Since mid-July, due to environmental protection and production factors and the difficulty in purchasing coking coal raw materials, the East China and Central China regions have declined significantly. The inventory of independent coking enterprises continued to decrease, and the inventory of coke enterprises continued to decline. It once returned to the historical low point and entered the middle and early ten days of November and November. Due to the continuous release of the supply end, the coke inventory of 53 domestic independent coke enterprises was on the rise. Beginning in the middle and late November, the steel mills replenished the warehouse, and the inventory of the coke enterprises fell back. The coke inventory of the steel mills remained at a low level. From December to now, the inventory of coke enterprises remained basically stable, and the coke inventory of steel mills rebounded sharply. At present, the inventory of 53 coke enterprises is about 500,000 tons, and the coke inventory of steel mills has rebounded to 11.5 days, close to the 2015 high. Figure 28: Coke stock unit: 10,000 tons Source: Wind, Cinda Futures R&D Center In September and October, due to the good demand for coke, the transaction was good, and the inventory fell back, basically in a downward trend. In November, when the steel plant replenished the warehouse, the coke was sold well and the port inventory gradually recovered. In December and January, port inventories basically showed a downward trend. Up to now, port coke stocks: Tianjin Port 173, Lianyungang 17, Rizhao Port 45, Qingdao Port 35. Figure 29: Coke port stock unit: 10,000 tons Source: Wind, Cinda Futures R&D Center Cinda Futures Sina statement: Sina's posting of this article for the purpose of transmitting more information does not mean agreeing with its views or confirming its description. Article content is for reference only and does not constitute investment advice. Investors operate on this basis at their own risk. Office Organizer,Diy Desk Organizer,Desktop File Organizer,Desktop Organiser Nanjing Intime Import and Export co., Ltd. , https://www.china-intime.com